Analytics is (are?) defined typically as discovery and communication of meaningful patterns in data along with its statistical algorithms and tools. A more appropriate definition of analytics would be: generalizing beyond what is known, which is the activity of human inferencing, specifically inductive reasoning. For example, we see a pattern of sales data over time and infer that sales for next month will be a certain amount. How did we decide on that amount?
For centuries, the human race has been expertly generalizing beyond known data, leading to its dominance among other species. More recently, we have applied analytical tools to augment our reasoning, much like we used telescopes and microscopes to extend our senses. And, this augmentation has been quite successful! Think of analytics like the adoption of eyeglasses in the 13th century. When viewing a complex system, a person without analytical guidance will be bumping into a lot of walls!
The point is that analytics is an augmentation of human judgments with analytical reasoning to generalize beyond what is known. There is a symbiotic marriage of human and computer, in which the human should be in control. And therein lies a big problem.
We Can Not Handle the Truth!
 Big data is creeping closer to the full nasty complexity of how humans sense reality. The problem with big data is not the technology needed to cope the three V’s (volume, velocity, variety), but the limited ability of humans to comprehend its significance and implications.
Analytics is no longer a nice-to-have addition but a must-have essential capability to manage our corporations and governments. We can not handle the truth embedded in all our big data. Paradoxically we have more data than we are able to comprehend, yet we have a better tools to generalize. We are dependent on our analytic tools to derive meaning from our distilled reality, as our known data.
Being Close to Our Data
As a naive assistant professor, my first teaching responsibility was a course on Information Technology required of all MBA students. In those years, business students regarded learning about computers as akin to learning to type, a skill for lowly clerical employees. The challenge was to convince these students that computer technology would enable you as a future manager to make better business decisions. It was a hard sell!
The research focus was on decision support systems. The objective was designing systems to enable decision makers to make better decisions. The essential ingredient was database management system to organize data consistently. Third normal form, anyone? (This was a decade before notions of data warehouse and single version of the truth.) We did not have much data since all came from business transactions coarsely recorded. We did not know much about the customers who bought products or the suppliers that provided raw materials. But, we did know the data that was collected. We could print it all out on paper, measuring feet tall. Despite having a limited view of our business activity (as compared to today), we could be closer to that data. Managers spent time looking at those stupid listings and then arguing in staff meetings its implications to the marketing budget.
Rolling forward a few decades, we have a thousand times more and richer data. Scaled down, we now have the same richness of data as if we owned, managed, and operated a corner grocery store in a small town for many years. Back then, it was all in our head. Now, it is all in our Hadoop data lake. Thus, we have sadly lost the sense of being personally close to our data.
The good news is that we have the means to reestablish that closeness to data via the emerging analytic technology. The bad news is that current approaches assume that we abdicate our human judgment and just trust the outputs from the analytics. There is no way to check the numbers on your Excel spreadsheet! Those neural networks work in strange ways. The other bad news is that descriptive analytics and especially visual analysis have improved but have not kept pace with the explosion in advanced analytics. More precisely, advanced analytics have become black boxes where you can see the data going in and the results coming out but clueless about what is inside. Humans (whose butts are on the line to make a decision) are clueless. We are losing more of that closeness.
Turning Analytics Inside Out
The direction is to turn analytic algorithms inside out. Instead taking persons and allowing them to descend into the black box, take the algorithm and let it do its thing in the public square. In a course on computer algorithms, I did not understand the difference among all the sorting algorithm, which is fundamental to much of computing. …until I saw a simulation of sorting algorithms doing their unique patterns of sorting. I knew the inputs, outputs, and each line of code, but I did not understand until I saw (sensed) the emergent behavior of the sorting system. Bye, bye black box!
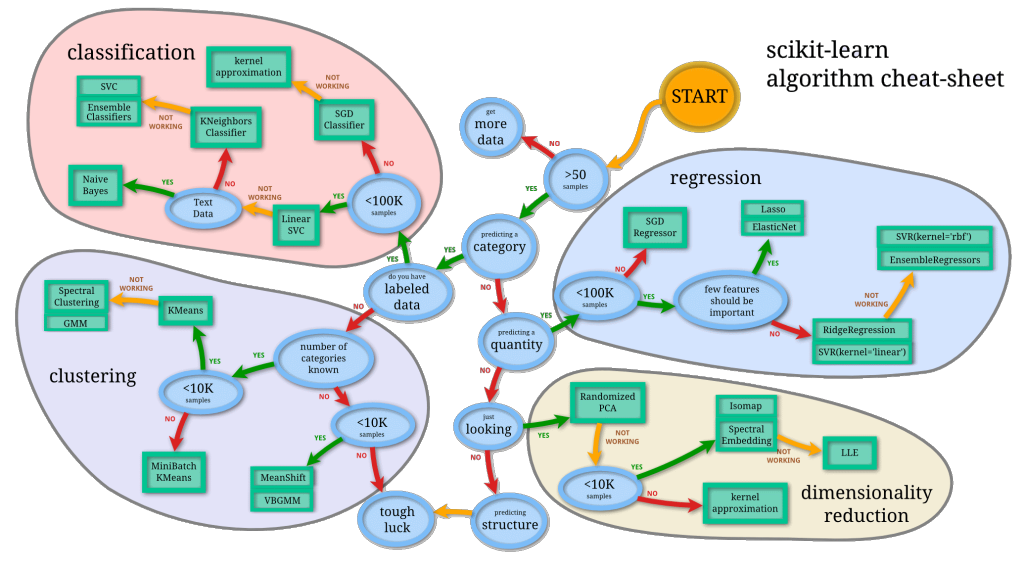
For instance, a popular analytics library is scikit-learn for the Python community. Their cheat-sheet nicely summarizes the usage of analytical algorithms into a single diagram. It leads an analyst through a series of questions about their data, narrowing the choice of which procedure to involve.
 How Does This Relate to Immersive Analytics?
Analytics should occur in the public square. People need to occupy center stage, sensing the analytics crunching numbers, day in and day out.
Using the scikit-learn cheat-sheet above, what if we designed a data world whose landscape was similar. What if analysts would wander, sensing the effects upon their data as the procedures were being applied. Wonder what surprises may occur.
The analogy is… Datasets are like crops (lettuce, beans, tomatoes) at a huge farm. Analytics are like gardener bots who are tending the plants, doing a clustering there and a regression over there. The analyst team manage the farm, day by day, sensing what grows and why. It all happens in front of their senses.
This analogy illustrates the shift in paradigm and architecture that immersive analytics is suggesting.
Version 2 – 20151007
